acf domain was triggered too early. This is usually an indicator for some code in the plugin or theme running too early. Translations should be loaded at the init action or later. Please see Debugging in WordPress for more information. (This message was added in version 6.7.0.) in /var/www/sightdrive.net/public/wp-includes/functions.php on line 6131simple-custom-post-order domain was triggered too early. This is usually an indicator for some code in the plugin or theme running too early. Translations should be loaded at the init action or later. Please see Debugging in WordPress for more information. (This message was added in version 6.7.0.) in /var/www/sightdrive.net/public/wp-includes/functions.php on line 6131
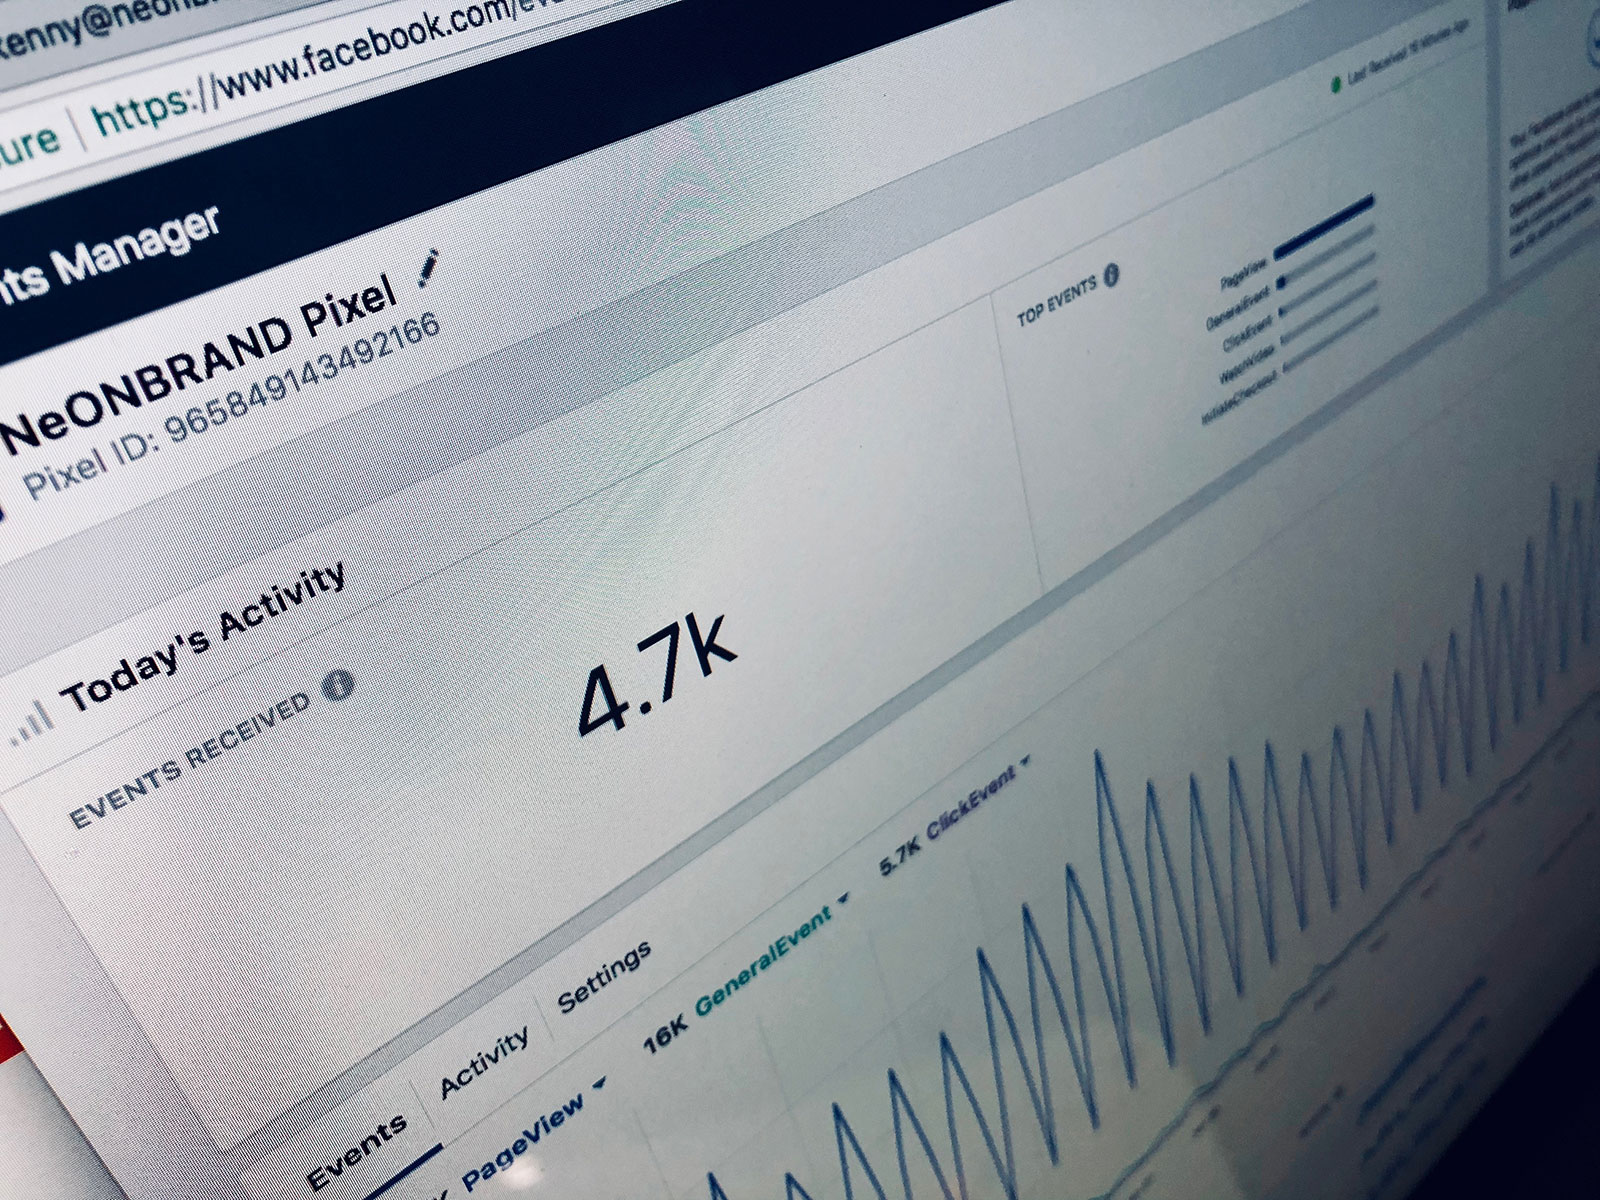
Perhaps the single most valuable reporting feature of Sightdrive, interactive reporting allows Managers and Senior Staff to review analysed data via reports in realtime. This is accomplished through the use of interactive dashboards. Dashboards are application interfaces that display a complete-yet-succinct overview of all the important information that a managers might wish to review. This data is generally represented visually in the form of graphs, tables, charts, etc. But more than functioning as a static ‘snapshot’ of data, the Sightdrive interactive dashboard gives Managers and Senior Staff the opportunity to delve as deeply into the data as they may wish to, highlighting specific datasets, and achieving a more complete picture of the elements that play a role in business success.
Take your business to new heights with our simple, flexible and powerful data analysis software.
Sightdrive has revolutionised the way we run our dealership.
4.8

Average customer satisfaction increase
Annual savings in staff costs due to Sightdrive
Saved by automated reporting each week
Increase in workshop staff performance